Friday, August 9, 2024

Resurrecting The Met One MSO Weather Sensor


We have three defective MSO weather sensors from Met One Instruments that have been sitting in the junk box for over 7 years. Upon checking the Met One Instruments website, we found that this product has long been discontinued and replaced by Met One AIO weather sensor. Both models are identical except the AIO weather sensor now using an ultrasonic wind speed and wind direction sensor. 

These three MSO units suffered a common failure-- the board's microcontroller was damaged by an electrical surge, rendering the entire unit useless. For those unfamiliar with the MSO, let me give a short description about the instrument. It is a compact weather instrument made by Met One Instruments. The MSO includes an anemometer for measuring wind speed, a vane for measuring wind direction, a digital pressure sensor for atmospheric pressure and lastly it has a temperature/humidity sensor for measuring ambient temperature and relative humidity. That's 5 weather sensors combined in a small package.


For this project, I plan to reuse the potentiometer in the wind direction since it is still functional. The MSO uses a 360-degree 10K potentiometer and a reed switch for the anemometer assembly. 

For the ambient temperature, humidity and barometric pressure, I decided to use the new BME280 digital sensor from Adafruit. All these sensors can be easily integrated and processed by an Arduino microcontroller.


I built my prototype board on a single PCB measuring (2.5in x 2.5in) in size. The Arduino nano and the LM2596 buck converter are all mounted on the top. The buck converter is more convenient than the typical 7805 regulator since in can handle up to 35V of input without heating. Another important module in the project is the RS232 to TTL converter. It is mounted at the back of the pcb so only the 4 pins are visible on the surface. The converter is responsible for interfacing the Arduino to the outside world!

The MSO weather sensor sends a serial data every second. There are 5 parameters separated by a comma and terminated by a carriage return (cr) and line feed (lf). The format is:

Temp,Humidity,Pressure,Wind Speed,Wind Direction(cr)(lf)


We can use a datalogger or a serial data terminal program such as the RealTerm to display the real-time readings of the MSO weather sensor.  Below is the code used by the Arduino to integrate all the 5 sensors!


/***************************************************************************
  This is a library for the BME280 humidity, temperature & pressure sensor
  This example shows how to take Sensor Events instead of direct readings
  
  Designed specifically to work with the Adafruit BME280 Breakout
  ----> http://www.adafruit.com/products/2652

  These sensors use I2C or SPI to communicate, 2 or 4 pins are required
  to interface.

  Adafruit invests time and resources providing this open source code,
  please support Adafruit and open-source hardware by purchasing products
  from Adafruit!

  Written by Limor Fried & Kevin Townsend for Adafruit Industries.
  BSD license, all text above must be included in any redistribution
 ***************************************************************************/

#include <Wire.h>
#include <SPI.h>
#include <Adafruit_BME280.h>


Adafruit_BME280 bme; // use I2C interface
Adafruit_Sensor *bme_temp = bme.getTemperatureSensor();
Adafruit_Sensor *bme_pressure = bme.getPressureSensor();
Adafruit_Sensor *bme_humidity = bme.getHumiditySensor();


const int pulsePin = 7; // Pin where the pulse signal is connected
unsigned long duration; // Duration of the pulse in microseconds
int frequency; // Frequency of the pulse in Hertz

void setup() {
  pinMode(pulsePin, INPUT_PULLUP);
  Serial.begin(9600);
  Serial.println(F("BME280 Sensor event test"));

  if (!bme.begin()) {
    Serial.println(F("Could not find a valid BME280 sensor, check wiring!"));
    while (1) delay(10);
  }
  
  //bme_temp->printSensorDetails();
  //bme_pressure->printSensorDetails();
  //bme_humidity->printSensorDetails();

  Serial.println();
  Serial.println("Multi Parameter Weather Sensor");
  Serial.println("Developed by Hevir, DU1VSS, 8/8/24");
  Serial.println();
  Serial.println("AT,RH,BP,WS,WD");
  Serial.println();


}

void loop() {

  ///   code for bme280   ///
  sensors_event_t temp_event, pressure_event, humidity_event;
  bme_temp->getEvent(&temp_event);
  bme_pressure->getEvent(&pressure_event);
  bme_humidity->getEvent(&humidity_event);

  ///   code for frequency counter   ///
    
    duration = pulseIn(pulsePin, LOW); //measure the duration of the pulse.
    frequency = 1000000.0 / duration; // Frequency = 1 / period, period = duration in microseconds
    float ws = ((frequency * 0.805) + 0.1748);


  ///   code for wind direction   ///

  int raw = analogRead(A2);
  int wd = (raw * (5.0 / 1023.0) * 72);


  Serial.print(temp_event.temperature);
  Serial.print(",");

  Serial.print(humidity_event.relative_humidity);
  Serial.print(",");

  Serial.print(pressure_event.pressure);
  Serial.print(",");

  Serial.print(ws);
  Serial.print(",");

  Serial.print (wd);
  Serial.print(",");

  Serial.print ("000"); //This extra line is included for siap+micros to parse the data correctly.
  Serial.println();

  delay(1000);
}


---73 de du1vss


Tuesday, July 9, 2024

Measuring the Impedance of a UHF Quadloop


Quad loop antenna is indeed has a 100ohms impedance at the feed point. I tried to build a UHF version of the quad and sweep its frequency response using my handy antenna analyzer. 


Quad loop needs a quarter wavelength of 75 ohm cable in order to transform its impedance from 100ohms to 50ohms.


---73 de du1vss

Monday, October 16, 2023

DIY 30W Power meter using 10dB Attenuator


While browsing the internet I came across a 100W/10dB attenuator resistor with a surprisingly low price. This sparked an idea in my mind - I could potentially use this affordable attenuators as a dummy load. What's more, I could connect a diode across its output to make a simple power meter.


The attenuator serves two purposes. 

1. It could function as dummy load as long as you terminate the output terminal with a 50 ohm load.
2. The rf detector is not subjected to extreme rf power as it is connected after the attenuator output.

Given the above details, I started the project as soon as the parts arrived. I had plenty of 180W/2W resistors in my junk box so I created a dummy load using them. According to my calculations, for a 30W of rf input, the 10dB / 100W resistor should effectively reduce it to approximately 3W and my 4 pieces of 180 ohm/2W resistors can safely dissipate the remaining 3W of power.


1N4148 diode is connected across the attenuator output to sample the amount of power being dissipated by the dummy load resistors. A sensitive 200uA ammeter is used to display the power measurement.


I calibrated my DIY power meter using Diamond SX200 swr/power meter as a reference. During the initial test, it exhibited a broadband characteristic. I conducted measurement validation across a range from 88MHz until 173MHz and observed a pleasant flat response. ---73 de du1vss

Monday, September 11, 2023

Advantech WISE-4220-S231 IoT Wireless Module


Today, I will be sharing the advantages of using IoT devices such as the Advantech WISE-4220-S231 wireless sensor. The  WISE 4220 series is an Ethernet-based wireless  IoT device.  What makes this device particularly useful is that its I/0 module is removable and can be replaced with other variants for different applications. Below are the listing of available I/O module for the WISE-4220 series
  1. S231 - built-in temperature and humidity sensors.
  2. S214 - 4 analog inputs and 4 digital inputs.
  3. S250 - 6 digital inputs, 2 digital outputs and 1 rs-485 input.
  4. S251 - 6 digital inputs and 1 rs-485 input.


What we have on-hand is the WISE-4220 with S231 variant. Powering the module is simple. It accepts voltages ranging from 10Vdc to 50Vdc. How convenient is that right? Just wait for a few seconds after powering the module and it will start broadcasting its SSID and ready to accepts WiFi connections. You can use your own cellphone or pc to access the wireless web interface. WISE-4220 can be also configured to connect over a wireless network. Data transmission uses the industry standard TCP Modbus protocol. Accessing the module anywhere is much easier as long as you are within the same network.


---73 de du1vss

Tuesday, June 20, 2023

DIY Arduino Uno Data Logger


Another great project that you can make with arduino is the datalogger. The basic design of a logger calls for a timer, a memory and converter that will translate analog signals from the sensor into a digital data. Today, all of these components are readily available and cheap too. So here are the things you need.

1. Arduino Uno microcontroller.
    

2. 16 x 2 LCD module.


3. DS1307 RTC module.

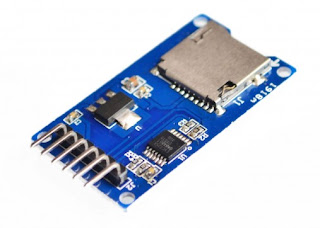
4. MicroSD Card module.


Start connecting the modules to the arduino by following the picture below. Take note that LCD module is not included in the wiring diagram.


DA1307 RTC module also uses the A4 and A5 pins of the Arduino for its SCL and SDA line. This leaves A0, A1, A2 and A3 as your remaining analog inputs. Never the less, it is still sufficient for this project.


Above is the picture of my completed datalogger. Sampling time is set every 5 minutes. The LCD displays the current time and data but during a short sampling period, it will display **** to tell the user that analog signals at A0, A1, A2 and A3 has been sampled and logged into the sd card successfully.

Below is the code I wrote for my arduino datalogger.

/////////////////////////////////////////////////////////////////////////////////////////////////////////////////////////////////////////////

#include <uRTCLib.h>
#include <LiquidCrystal.h>
#include <SPI.h>
#include <SD.h>

File myFile;
uRTCLib rtc;

const int rs = 9, en = 8, d4 = 5, d5 = 4, d6 = 3, d7 = 2;
LiquidCrystal lcd(rs, en, d4, d5, d6, d7);


void setup() {
delay (2000);

lcd.begin(16, 2);  //initialize LCD module.


if (!SD.begin(10))   //initialize SD module. Chipselect is 10
{
  lcd.clear();
  lcd.setCursor(0,0);
  lcd.print("SD Init Failed");
  while(1);
}

lcd.print("SD Init Done");
delay(1000);


  #ifdef ARDUINO_ARCH_ESP8266
    URTCLIB_WIRE.begin(0, 2); // D3 and D4 on ESP8266
  #else
    URTCLIB_WIRE.begin();
  #endif


  rtc.set_rtc_address(0x68);

  // Only used once, then disabled
  //  rtc.set(0, 42, 16, 6, 2, 5, 15);
  //  RTCLib::set(byte second, byte minute, byte hour, byte dayOfWeek,
// byte dayOfMonth, byte month, byte year)

  //rtc.set(0, 19, 12, 6, 3, 6, 23);
 
}

void loop()

{
  rtc.refresh();
  lcd.clear();
 

  lcd.setCursor(0, 0);


  lcd.print(rtc.month());
  lcd.print('/');
  lcd.print(rtc.day());
  lcd.print('/');
  lcd.print(rtc.year());


  lcd.print(' ');
 

  lcd.print(rtc.hour());
  lcd.print(':');
  lcd.print(rtc.minute());
  lcd.print(':');
  lcd.print(rtc.second());
 
  lcd.setCursor(0, 1);
//  lcd.print("DOW: ");
//  lcd.print(rtc.dayOfWeek());

if  (rtc.dayOfWeek() == 1)
{lcd.print("Monday");}

if (rtc.dayOfWeek() == 2)
{lcd.print("Tuesday");}

if (rtc.dayOfWeek() == 3)
{lcd.print("Wednesday");}

if (rtc.dayOfWeek() == 4)
{lcd.print("Thursday");}

if (rtc.dayOfWeek() == 5)
{lcd.print("Friday");}

if (rtc.dayOfWeek() == 6)
{lcd.print("Saturday");}

else if (rtc.dayOfWeek() == 7)
{lcd.print("Sunday");}

  delay(1000);

  ////////////Code for data logger begins here....

  int x = (rtc.minute() % 5); /// minute value is divided by 5,
/// the remainder is stored
                               /// in integer x.

  if (x + rtc.second() == 0)  /// Sampling of the logger.
{

  float voltA0 = (analogRead(A0) * (5.0 / 1023.0));
  float voltA1 = (analogRead(A1) * (5.0 / 1023.0));
  float voltA2 = (analogRead(A2) * (5.0 / 1023.0));
  float voltA3 = (analogRead(A3) * (5.0 / 1023.0));


  myFile = SD.open("Logs.csv", FILE_WRITE);
 
  myFile.print(rtc.month());
  myFile.print('/');
  myFile.print(rtc.day());
  myFile.print('/');
  myFile.print(rtc.year());
  myFile.print(",");
  myFile.print(rtc.hour());
  myFile.print(":");
  myFile.print(rtc.minute());
  myFile.print(",");
  myFile.print(" ");
  myFile.print(" ");
  myFile.print(" ");
  myFile.print(" ");  
  myFile.print(voltA0);
  myFile.print(",");
  myFile.print(voltA1);
  myFile.print(",");
  myFile.print(voltA2);
  myFile.print(",");
  myFile.print(voltA3);
  myFile.println(" ");
 

  myFile.close();

  lcd.setCursor(12, 1);
  lcd.print("XXXX"); ///Prints XXXXXX in the lcd after
  delay(200);        ///recording all the analog channels.
}

else
{
 

}

}


---73 de du1vss


Wednesday, September 28, 2022

Homebrew SWR / Power Meter for HF and VHF


A friend is asking if I can fabricate a low-cost SWR/power meter with accurate performance up to  144MHz. One of the designs I have attempted is the modified Bruene directional coupler from Roy Lewallen, W7EL.


The above circuit represents a portion of W7EL's original article. I have extracted only the directional coupler circuit, as we intend to employ an analog 200uA meter for indication.

The toroidal transformers were made from FT37-43 cores, using 10 turns in the secondary winding and a single turn in the primary winding. While wire thickness is not critical, I have opted for #24awg enamel wire for the secondary winding. The two diodes employed are a closely matched pair of 1N4148, and the two resistors are rated at 47 ohms (1/2 watt). Measures have been taken to maintain minimal lead lengths, and the compact PCB housing the circuit is conveniently positioned adjacent to the SO239 connectors.


The meter circuit incorporates toggle switches and calibration trimmers essential for precise meter calibration.

Toggle switch S1 serves the purpose of selecting between forward and reflected power, whereas toggle switch S2 facilitates the choice between power and SWR modes for measurement.


During the calibration process, I am using my Diamond SX200 meter as a reference standard, and my ICOM IC-2200H is employed to verify the power readings for both power meters. Additionally, I have prepared three distinct dummy loads – each with impedance values of 50 ohms, 75 ohms, and 100 ohms respectively. These dummy loads are necessary components for SWR calibration.


Meter calibration using SX200 as reference standard.


Actual dummy load used in the swr calibration.


Testing power response at 88MHz to 108MHz.


Testing the power response from 26MHz to 27MHz.


Testing the power response from 136MHz to 150MHz,


Assembling this project is relatively straightforward for me; however, the calibration process presents challenges. Notably, around 150MHz, there is a noticeable decline in power response. It appears that this might already be pushing the upper limits of my power meter's capabilities. Moreover, I've observed toroid transformer heating, particularly during continuous 60W testing.


I extend my heartfelt gratitude to my friend, Sir Leandro, for placing trust in and providing unwavering support for this undertaking. --- 73 de DU1VSS


Monday, September 26, 2022

Digital Tank Level Meter


At my current workplace, we operate with large tanks designed for storing huge quantities of chocolates. Regrettably, these tanks lack built-in sight glasses, imposing a burden on operators who must climb ladders frequently to gauge tank levels before initiating product transfers from the ball mill. One unfortunate incident occurred previously due to insufficient level awareness, resulting in chocolate overflow atop the tank. In response, we proposed  a solution: constructing a dual-function digital level meter.


Firstly, the meter communicates with the PLC, notifying it when the tank reaches full capacity. This triggers an immediate signal to halt the transfer pump, averting potential overflows.


Secondly, a digital display unit was installed adjacent to the tank, facilitating quick and convenient monitoring of the chocolate product's current level within the tank.


Collaborating with a friend, we divided tasks: he managed sensor mounting fabrication, while I undertook sensor selection and the microcontroller's wiring and programming.


At the heart of this project lies an important hardware component – an IFM photoelectric distance sensor. Operating on the principle of laser light measurement, it generates a standard current output (4-20mA). The sensor boasts a maximum measurement range of 10 meters, aligning perfectly with our tank's height and volume parameters.


The 16 x 2 dot matrix LCD together with the Arduino Uno microcontroller  will take care of the sampling of the analog signal from the sensor, do a simultaneous computation and display the level of the tank in real time.


To start the design we have to measure the dimension of the storage tank so that important values can be set in the sensor. The sensor will be mounted just below the lid  so this will be also the sensor origin.
Start of signal (4mA) will appear at 1,450mm below from the sensor origin and the end of signal (20mA) will be at 250mm below the sensor origin.


Given that the sensor generates a current output, we need to convert this current into a 0-5V range, which is in line with the analog channels' specifications of our microcontroller. To fulfill this task, my chosen approach involves adding a 150 ohm resistor soldered in parallel with the (A0) analog channel of the microcontroller. This configuration effectively transforms the sensor's current output into an analog voltage range spanning from 0.6V to 3.0V.


Pin 1 of the sensor serves as the +24V power input, while the sensor's current output is directed to pin 2. This output will be directly connected to the A0 analog channel of our microcontroller. Pin 4 is a normally closed (NC) contact embedded within the sensor. When the product level exceeds the container's lid, this contact will open, triggering a signal sent to the PLC and prompting the transfer pump to halt. Finally, pin 3 functions as the common ground connection.


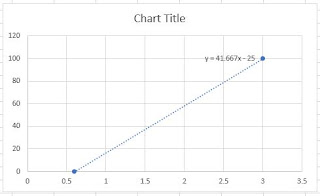
The tank's content will be visually reported as a percentage level, which we can achieve through mathematical calculations. Employing the Microsoft Excel application, we can create a chart and derive a linear expression from the sensor's range and the corresponding % level data. This linear expression, representing a calibration curve, will then be utilized by the microcontroller to execute calculations and accurately display the tank's % level.


calibration curve linear expression: Y= 41.667X-25
where Y is the  % Level and X is the analog voltage sampled by the microcontroller at channel A0.


The difference in voltage between the photoelectric distance sensor and the microcontroller is efficiently managed by LM2596 buck down converter. This setup accommodates the sensor's operation at a 24Vdc rail while ensuring the microcontroller operates on a 5Vdc supply. Opting for a linear regulator like the 7805 proves unfeasible in this scenario due to the substantial difference between the input and output voltage levels.


After completing the hardware wiring and testing, our functional level meter is now put to test. Below are the actual pictures taken of the display unit installed near the tank.


 I would like to thank my friend, sir Cliff for helping me complete this project. ---73 de du1vss